February 10, 2025
U.S. Airline Cost Migration
With U.S. carriers posting record revenues, mba examines what is driving the growth across carriers, how costs are evolving alongside revenues, and if there are any notable changes in cost composition.
_________________________________________________________________________________
U.S. air carriers across the board have experienced revenue growth over 2019 figures. In all instances, this increase is partly explained by passenger yield growth and partly by an expansion in traffic volumes. In most instances, it is further boosted by growth in other revenues, such as loyalty program revenues and cargo operations. The performance does, however, vary between carriers, with Hawaiian and JetBlue lagging others and Sun Country and Frontier coming out ahead. United, Alaska, and Allegiant have all shown robust growth.
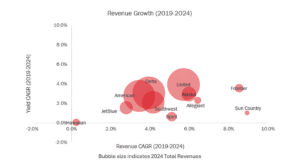
Source: Airlines earning releases; Bloomberg Analyst estimates; mba analysis.
Note: Hawaiian and Spirit’s values are based on Bloomberg analyst estimates for 2024. Delta’s revenue excludes revenues from its refinery operations.
While airline revenues have grown since pre-COVID times, so have their costs. Unit cost, as measured by cost[1] per available seat mile (CASM), has grown at an average annual rate ranging between 3.0% and 6.5% between 2019-2024, depending on the airline. This CASM growth has outpaced unit revenue (as measured by revenue[2] per available seat mile or RASM) increases in most instances, leading a decline in unit (and overall) margins. The exception to this are United and Sun Country, which saw a marginal increase in unit margins. Moreover, while the Big Three legacy carriers have the highest unit costs, they have managed to maintain higher unit margins.
________________
[1] Operating expense
[2] Total revenue
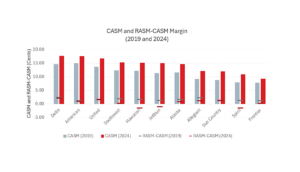
Source: Airlines earning releases; Bloomberg Analyst estimates; mba analysis.
Note: Hawaiian and Spirit’s values are based on Bloomberg analyst estimates for 2024. Delta’s figures exclude its refinery operations.
The increase in airline operating costs is a result of various factors, with no one particular item being the main driver. Personnel expenses, fuel costs, aircraft ownership costs, landing fees, maintenance expenses, etc. have all climbed in such a way over the last five years, that the cost composition of mainline and low-cost carriers (LCCs) is effectively unchanged since 2019. Labor remains the largest cost item for U.S. carriers, followed by fuel.
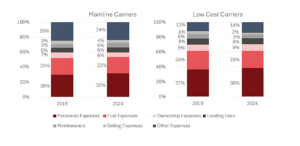
Source: Airlines earning releases; Bloomberg Analyst estimates; mba analysis.
Note: Mainline carriers include American, Alaska, Delta, Hawaiian, and United. LCC include Allegiant, Frontier, JetBlue, Southwest, Spirit, and Sun Country.
If you have any questions or would like to discuss any of mba’s commentary above, please contact mba Aviation Strategic Consulting Team at strategy@mba.aero.

